Spot Buys

Optimize your purchases with an effective dashboard

Published By
Olivier Audino
Tags
Sourcing
In our hyper-connected world, maintaining full control over spending is more crucial than ever to safeguard financial health.

A well-designed purchasing dashboard serves as the central key to clearly visualizing transactions, tracking cash flow in real time, and making data-backed decisions. Whether you are managing corporate budgets or overseeing individual expenditure, understanding where every unit of capital goes is essential for long-term financial stability.

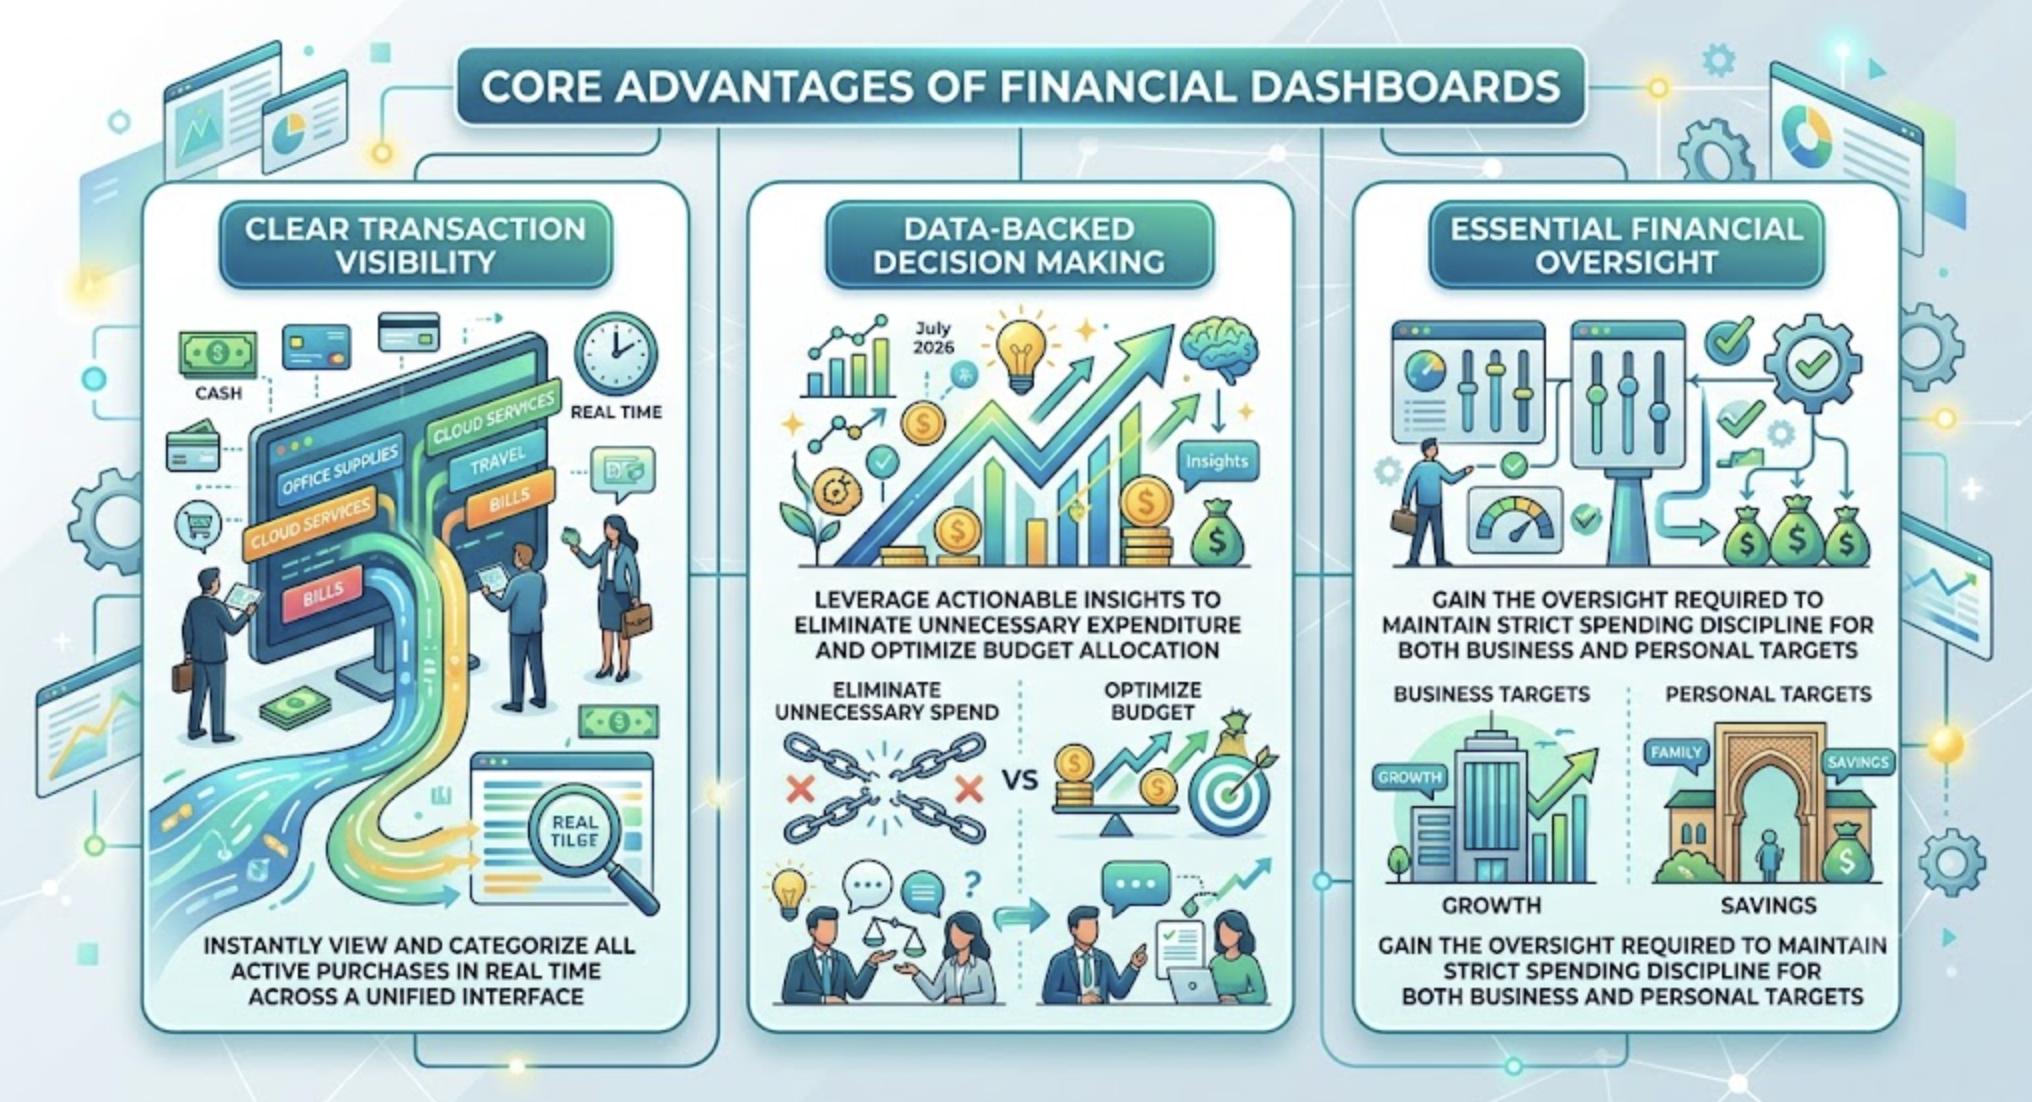
Core Advantages of Financial Dashboards

  • Clear Transaction Visibility: Instantly view and categorize all active purchases in real time across a unified interface.
  • Data-Backed Decision Making: Leverage actionable insights to eliminate unnecessary expenditure and optimize budget allocation.
  • Essential Financial Oversight: Gain the oversight required to maintain strict spending discipline for both business and personal targets.

Transform Your Financial Management Today

Make Dashboard Analytics Your Best Ally

Integrating a modern dashboard into your purchasing workflow transforms complex financial data into clear, strategic advantages.

Discover how optimized visualization tools can revolutionize your spending control and elevate your financial management today.

What is a Purchasing Dashboard? Definition and Objectives

A purchasing dashboard is a crucial analytical tool designed to synthesize essential data relating to an enterprise's procurement activities at a single glance.

Its core objective is to establish accurate, continuous performance monitoring that supports both strategic planning and daily operational decisions. By delivering a transparent and real-time view of procurement health, it empowers decision-makers to rapidly identify cost-saving opportunities and mitigate supply chain risks.

1. Primary Types of Purchasing Dashboards

Purchasing dashboards are tailored to specific management needs across three primary operational levels:

Strategic Dashboards: Track long-term business goals and ensure procurement strategies align with overall corporate vision.
Operational Dashboards: Focus on daily workflow efficiency, order tracking, and day-to-day procurement operations.
Tactical Dashboards: Manage targeted operational actions, such as supplier contract performance and active rate negotiations.

Core Dashboard Classification Framework

  • Strategic Dashboard: Delivers a global overview of long-term goals and corporate strategic alignment.
  • Operational Dashboard: Provides daily monitoring and optimizes the efficiency of procurement processes.
  • Tactical Dashboard: Guides the execution of specific, detailed actions and vendor management workflows.

2. Dashboard Functional Comparison Matrix

Type of Dashboard Primary Objective Operational Usage & Scope
Strategic Long-term monitoring & alignment Executive planning, budget forecasting, and overall corporate strategy
Operational Daily process tracking Day-to-day procurement management and workflow optimization
Tactical Management of specific actions Detailed vendor negotiations, compliance auditing, and contract management

Conclusion: Elevate Your Procurement Analytics

Transform Procurement Data into Actionable Insights

Deploying the right combination of strategic, operational, and tactical dashboards provides complete control over your enterprise spending.

Empower your team with real-time visualization tools to streamline sourcing processes, manage risk, and optimize working capital today.

The Benefits of a Purchasing Dashboard

Implementing a modern purchasing dashboard transforms raw spend data into actionable strategic intelligence.

By consolidating procurement metrics into a centralized visual interface, organizations gain full operational visibility, empower data-backed decision-making, and establish proactive performance tracking across all sourcing channels.

1. Improving Visibility and Transparency

Deploying a purchasing dashboard significantly optimizes real-time visibility into enterprise expenditure and daily supply chain operations.

Procurement managers can monitor purchase order statuses, vendor compliance, and actual spending in real time. This heightened transparency makes it easy to pinpoint budget overruns or supply chain bottlenecks early—allowing teams to take corrective action before financial forecasts are compromised.

2. Facilitating Data-Based Decision Making

Centralizing procurement metrics into a single dashboard provides executive decision-makers with a unified, verified source of truth.

By substituting intuition and guesswork with hard historical data, managers can enter supplier contract negotiations with complete confidence, leveraging proven volume trends and past vendor performance metrics to secure optimal commercial terms.

Key Purchasing KPIs to Monitor

  • Total Purchase Cost: End-to-end spend tracking across all procurement categories and business units.
  • Average Delivery Time per Supplier: Lead time monitoring to gauge supply chain reliability and vendor SLAs.
  • Product Compliance Rate: Percentage of delivered goods meeting strict quality and specification benchmarks.
  • Cost Reduction Performance: Measurable savings achieved against baseline historical expenditure and targeted budgets.

3. Performance Monitoring and Anomaly Detection

An effective dashboard serves as a continuous radar for tracking both short-term operational targets and long-term corporate goals.

Systematic KPI analysis enables procurement leaders to continuously measure strategy effectiveness, while automated data tracking quickly flags anomalies or margin discrepancies before they negatively affect company profitability.

4. Summary of Strategic Benefits

Strategic Advantage Operational Impact & Description
Transparency Real-time access to accurate spending data and vendor performance metrics
Decision-Making Centralized database enabling simplified data analysis and confident supplier negotiation
Performance Tracking Targeted KPI monitoring to proactively adjust and optimize procurement strategies

Conclusion: Drive ROI with Advanced Dashboard Analytics

Maximize Your Sourcing Efficiency Today

A well-structured purchasing dashboard converts raw data into a powerful competitive advantage for growing enterprises.

Empower your procurement leaders with real-time transparency, data-backed negotiation tools, and proactive KPI tracking to safeguard your bottom line.
Concrete Examples of Purchasing Dashboards

An effective purchasing dashboard begins with the precise tracking of Key Performance Indicators (KPIs) essential for procurement excellence.

Monitoring metrics such as total procurement expenditure, delivery deadline compliance rates, and product quality scores enables organizations to evaluate operational efficiency, pinpoint cost variances, and rapidly implement strategic improvements.

Frequently Monitored Purchasing KPIs

  • Average Purchase Cost per Unit: Track total spending per unit to identify volume savings and price variance.
  • Supplier Service Rate: Evaluate vendor reliability and fulfillment accuracy across active contracts.
  • Order Satisfaction Index: Measure internal user satisfaction and overall order accuracy.
  • On-Time Delivery Performance: Compare actual delivery lead times against agreed supply schedules.

1. KPI Performance & Target Benchmark Matrix

Key Performance Indicator (KPI) Current Operational Value Strategic Target
Average Purchase Cost €250 €200
Supplier Service Rate 95% 98%
Delivery Performance 90% 95%

Conclusion: Master Your Procurement Performance

Turn KPI Tracking into Strategic Savings

Setting clear targets and tracking core procurement KPIs enables procurement teams to maintain strict budget control and elevate supplier performance.

Empower your organization with real-time analytics dashboards to systematically hit performance benchmarks and maximize profitability.

Risk Management and Supplier Assessment

Risk assessment is a critical dimension of a modern purchasing dashboard.

By systematically evaluating vendor-related risks, organizations can prevent potential supply disruptions and optimize supply chain resilience. Dashboards track vital risk vectors to ensure operational stability and maintain continuous supplier performance.

Core Supplier Risk Indicators

  • Financial Reliability of the Supplier: Continuous auditing of vendor solvency to avoid supply chain disruptions.
  • Dependence on Critical Raw Materials: Tracking commodity exposure and material scarcity vulnerabilities.
  • Environmental & Social Compliance: Ensuring supplier adherence to environmental benchmarks and ethical labor standards.

1. Impact of Risk Management on Purchasing Performance

Proactive risk management directly elevates procurement capability and bottom-line protection.

By identifying vulnerabilities and potential bottlenecks in the supply network early, businesses can implement mitigation strategies that ensure seamless operational continuity while avoiding unforeseen emergency expenses.

Cost Optimization and Expense Analysis

Analyzing expenditure through a centralized dashboard enables procurement teams to uncover significant cost-optimization opportunities.

In-depth data analysis reveals abnormal spending trends, identifies opportunities for purchase consolidation, and highlights more competitive alternatives—allowing managers to refine sourcing strategies and reduce total procurement spend.

1. Strategic Cost Reduction Drivers

Cost Reduction Strategy Operational Focus Strategic Dashboard Value
Volume Contract Negotiation Consolidating spend across categories Delivers leverage through real-time purchasing volume aggregation
Internal Process Optimization Eliminating administrative workflows Highlights processing bottlenecks and cuts transaction costs
Competitive Supplier Sourcing Evaluating market alternatives Compares price-to-quality ratios across prospective vendor networks

2. Real-Time Data Sourcing & Market Agility

Leveraging an advanced purchasing dashboard ensures that key sourcing decisions are rooted in accurate, up-to-date data.

This real-time visibility yields substantial long-term cost savings while enhancing company responsiveness to shifting market conditions and pricing fluctuations.

Conclusion: Protect Supply Continuity & Optimize Spend

Master Risk & Cost Management with Data Analytics

Integrating risk indicators and expense analytics into your purchasing dashboard turns procurement management into a resilient, high-margin driver.

Empower your procurement leaders to mitigate supply chain risks, streamline expenditure, and secure long-term commercial growth.

Tips to Optimize Your Purchasing Dashboard

To transform a purchasing dashboard from a static reporting tool into an active strategic asset, organizations must align design choices with business goals, automate data streams, and maintain an intuitive user interface.

Implementing these best practices ensures rapid data interpretation, proactive decision-making, and seamless adoption across all procurement teams.

1. Customization, Automation & Interface Optimization

Goal-Oriented Customization: Tailor KPI selection directly to operational objectives. For manufacturers, tracking vendor delivery timelines and material lead times is essential; for service organizations, total cost control and contract compliance take precedence.

Real-Time Data Automation: Automated data collection eliminates manual entry delays, ensuring decision-makers work with live information to spot purchasing anomalies and supply bottlenecks instantly.

Streamlined UI Design: Avoid dashboard clutter. Use clear charts, intuitive visual hierarchies, and standard color coding so stakeholders can digest key performance metrics at a glance.

Recommended Dashboard Tools & Technologies

Selecting the right technology stack is pivotal to building an effective purchasing dashboard. Modern business intelligence (BI) solutions range from entry-level spreadsheets to enterprise-grade analytical platforms.

To guarantee successful software integration, define precise business needs early, provide hands-on team training, and schedule periodic software reviews to adapt to evolving procurement workflows.

Essential Features of Procurement Dashboard Tools

  • KPI Customization: Ability to configure tailored performance indicators and metric views for different user roles.
  • Automated Data Pipelines: Real-time background updates without requiring manual CSV uploads or database exports.
  • Enterprise Data Security: Role-based access controls to safeguard sensitive financial and vendor information.
  • ERP & System Integration: Seamless connectivity with accounting software, ERPs, and inventory management systems.

1. Dashboard Software Comparison Matrix

Software Platform Core Operational Strengths Limitations & Technical Demands
Power BI Extensive enterprise data integration, advanced visualizations, Microsoft ecosystem compatibility Requires technical expertise and data modeling knowledge
Tableau Deep visual analytics, intuitive dragon-and-drop interface, high flexibility Higher licensing costs for full corporate deployments
Excel Universal accessibility, low barrier to entry, highly familiar user base Limited scalability, lacks automated real-time enterprise analytics

Conclusion: Elevate Your Dashboard Strategy

Build a Responsive, High-Impact Purchasing Dashboard

Combining tailored KPI tracking with real-time automation and an intuitive software interface turns purchasing data into a powerful engine for profitability.

Empower your team with cutting-edge visual analytics tools to streamline sourcing decisions and maintain absolute control over enterprise spend.

Implementation and Effective Use of the Purchasing Dashboard

Successfully deploying a purchasing dashboard requires strategic planning, stakeholder alignment, technology evaluation, and structured change management.

From defining baseline KPIs to conducting real-world pilot tests, a systematic implementation roadmap ensures your dashboard delivers immediate operational visibility and drives long-term business value.

1. Key Integration Steps for Purchasing Dashboards

Define Specific Goals & Key KPIs: Clarify enterprise objectives—such as cost containment or vendor lead time optimization—and establish objective, measurable performance metrics.

Engage Stakeholders Early: Involve cross-functional procurement, finance, and IT teams throughout development to ensure the dashboard directly addresses end-user requirements.

Conduct Real-World Pilot Testing: Test dashboard configurations in live operational conditions prior to full rollout to identify bugs, refine workflows, and guarantee high internal adoption.

2. Selecting the Right Dashboard Technology Stack

Selecting the appropriate software platform depends on your company's data architecture, analytical complexity, and available budget.

Whether deploying enterprise Business Intelligence platforms like Microsoft Power BI and Tableau or custom-built Excel frameworks, organizations should evaluate software based on user accessibility, system integration depth, visual flexibility, and vendor support.

Strategies to Maximize Dashboard User Adoption

  • Comprehensive Training Programs: Educate teams on both technical navigation and analytical data interpretation.
  • Phased Rollout Approach: Introduce foundational reporting metrics first before deploying advanced predictive analytics.
  • Continuous Feedback Loops: Regularly gather end-user feedback to refine visualization views and update tracking indicators over time.

3. Case Studies: Enterprise Success Stories

Enterprise Primary Focus Area Strategic Impact & Dashboard Results
XYZ Corp
Manufacturing Leader
Cost & Spend Optimization Identified supply chain inefficiencies, renegotiated underperforming vendor contracts, and achieved major operational savings via real-time KPI tracking.
ABC Ltd
Technology Distributor
Product Quality & Vendor SLAs Established quality benchmarks across supplier networks, significantly reducing defect rates and elevating end-customer satisfaction.
GHI Inc
Sustainable Enterprise
ESG & Sustainable Procurement Tracked vendor carbon footprints and environmental compliance, building an ethical, transparent supply chain aligned with corporate ESG goals.

Conclusion: Transform Procurement with Data-Driven Dashboards

Turn Procurement Data into Strategic Advantage

From cost reduction and quality control to sustainable sourcing, a well-designed purchasing dashboard fundamentally elevates enterprise management.

Empower your decision-makers with robust technology platforms, structured team training, and real-time visualization tools to drive lasting commercial success.

Digital Revolution and the Future of Purchasing Dashboards

The convergence of advanced digital technologies is fundamentally reshaping how modern enterprises monitor, analyze, and optimize procurement activities.

Big Data, Artificial Intelligence, and Cloud Computing are transforming traditional purchasing dashboards into dynamic, real-time intelligence hubs—enabling predictive forecasting, process automation, and seamless global collaboration.

1. Impact of Big Data on Purchasing Dashboards

The era of Big Data feeds purchasing dashboards with unprecedented volume, velocity, and analytical depth.

By processing massive datasets across supplier networks, procurement professionals can anticipate market trends, assess supply risks with high precision, and continuously adjust sourcing strategies in real time—driving rapid, evidence-based decision-making.

2. Artificial Intelligence and Automation in Sourcing Analytics

Integrating Artificial Intelligence (AI) and automated workflows significantly elevates process efficiency across the procurement lifecycle.

AI algorithms analyze vast transaction volumes to detect potential cost savings and flag anomalies automatically. Automating repetitive administrative tasks frees up buyers to concentrate on complex strategic initiatives and vendor relationship development.

Technological Pillars Driving Dashboard Innovation

  • Big Data Analytics: Powers detailed, predictive analysis for accurate market forecasting.
  • Artificial Intelligence: Automates routine processes, optimizes resource allocation, and reduces costs.
  • Cloud Computing: Delivers global accessibility, real-time collaboration, and enterprise-grade data security.

3. Purchasing Dashboards in the Cloud Computing Era

Cloud computing offers exceptional flexibility and mobility for global procurement teams.

Cloud-hosted purchasing dashboards grant decision-makers real-time access to live spending analytics regardless of location. This ubiquity fosters seamless collaboration across geographically dispersed teams, reinforces global process consistency, and provides robust cybersecurity protection.

4. Technology Comparison Matrix

Next-Gen Technology Core Technical Advantages Impact on Purchasing Dashboards
Big Data Massive multi-source data processing Substantially improved forecasting accuracy and trend analysis
Artificial Intelligence Automated anomaly detection & workflow execution Resource optimization, reduced administrative burden, and cost reduction
Cloud Computing Anywhere accessibility, high scalability, and robust security Enhanced global team collaboration, process consistency, and data security

Conclusion: Future-Proof Your Sourcing Intelligence

Embrace the Future of Digital Procurement

Leveraging Big Data, AI, and Cloud infrastructure converts purchasing dashboards into high-performing strategic assets.

Empower your enterprise with real-time predictive analytics, automated workflows, and secure global connectivity to lead the digital transformation of procurement.

FAQ - Frequently Asked Questions About Purchasing Dashboards

Navigating the setup and optimization of a purchasing dashboard is critical for streamlining procurement operations.

Below are practical answers to common questions regarding implementation steps, recommended tools, cost optimization, team performance, and long-term dashboard maintenance.

1. How do I start implementing a purchasing dashboard?

Initial Assessment & Core KPIs: Begin by assessing your organization's specific procurement requirements and selecting high-impact Key Performance Indicators (KPIs).

A practical starting point is integrating core baseline metrics, such as total purchase costs and supplier delivery turnaround times.

2. What tools are recommended for creating a purchasing dashboard?

Enterprise BI Platforms: Leading Business Intelligence software platforms like Microsoft Power BI and Tableau are highly recommended.

These tools deliver extensive customization, advanced visual analytics, and seamless data integration features tailored for effective dashboard building.

3. How can you optimize costs through a dashboard?

Trend Tracking & Data-Driven Negotiations: Utilize visual analytics to monitor purchasing trends and identify your most cost-effective suppliers over time.

Analyzing historical spend data provides clear, objective leverage during contract renewals to negotiate lower rates and improved commercial terms.

Key Takeaways for Dashboard Success

  • Real-Time Performance Tracking: Identify operational bottlenecks early, such as tracking order error rates to improve accuracy.
  • Continuous Maintenance: Regularly update underlying data streams and periodically review KPI relevance.
  • Ongoing Team Training: Organize structured training sessions to ensure team members effectively interpret and act on dashboard insights.

4. How can a dashboard improve the performance of purchasing teams?

Operational Visibility & Error Reduction: Dashboards provide real-time visibility into operational performance, allowing teams to quickly spot and address inefficiencies.

For example, tracking the frequency of erroneous orders enables procurement managers to pinpoint root causes and continuously refine purchasing precision.

5. How do I maintain the purchasing dashboard over time?

System Maintenance & User Support: Ensure your dashboard system connects to automated, up-to-date data pipelines to maintain accuracy.

In addition, periodically review your KPI set to guarantee alignment with changing strategic goals, and conduct ongoing user training to maximize long-term software adoption.

Conclusion: Elevate Your Procurement Analytics

Master Sourcing Visibility and Cost Control

Implementing, optimizing, and maintaining a robust purchasing dashboard converts raw procurement data into an essential competitive advantage.

Empower your team with cutting-edge visual analytics tools, actionable KPI tracking, and structured user training to lead your enterprise toward data-driven procurement excellence.

Optimizing Procurement Beyond Basic Financial Management

Optimizing your purchases with an effective dashboard goes far beyond simple financial oversight. This tool evolves into an indispensable strategic partner—enabling decision-makers to anticipate market shifts, analyze performance metrics, and act with speed and precision.

By providing a comprehensive, 360-degree vision of operational opportunities and supply risks, a purchasing dashboard allows your business to adapt its sourcing strategies in real time, maximizing cost savings and operational efficiency.

Strategic Value of Procurement Dashboards

  • Proactive Decision-Making: Shift from reactive spend tracking to predictive, data-backed procurement planning.
  • 360-Degree Operational Oversight: Gain clear visibility over supply chain bottlenecks, supplier reliability, and category expenditures.
  • Real-Time Strategic Agility: Adapt purchasing tactics dynamically to market fluctuations and pricing shifts.

Transform Procurement Data into Competitive Advantage

Supercharge Your Purchasing Management Strategy

Implementing a tailored dashboard solution equips your organization with the visual analytics needed to turn raw data into tangible enterprise value.

Do not wait any longer to transform your procurement data into a lasting competitive advantage.

Line
Featured Post

Popular posts